Superstore Sales Performance Dashboard
Built an executive Power BI dashboard on the Superstore dataset for quarterly sales, regional performance, categories, and customer segments.
Published April 2026
TL;DR:
A Power BI dashboard project built with .pbip structure for version control and collaboration. It showcases quarterly sales, regional performance, and customer-segment insights. Watch the demo video below to see an executive walkthrough.
Demo: an executive walkthrough of the Superstore Sales Performance Dashboard showing quarterly sales, regional breakdowns, and customer-segment insights.
Project Overview
This project delivers executive-level insights into quarterly sales performance, designed to support data-driven decision-making across key business dimensions, including regional performance, product categories, customer segmentation, and financial strategy.
The underlying dataset is the well-known Superstore dataset, a fictional retail company's transactional sales data. It covers revenue, quantity, profit, and shipping across multiple regions, categories, and customer segments.
You can find the dataset on platforms like Kaggle or Tableau's Sample Data.
Dashboard Snapshot
Preview
Executive Overview — Quarterly Sales Performance
Regional Sales — West Region Breakdown
Report Pages & Navigation
Other pages (not included in v1.0.0) will cover: - Product category performance - Customer segmentation analysis - Strategic & financial insights (margin analysis, growth trends, etc.)
Global Filters / Slicers
- Quarter — Filter all pages by quarter (e.g.
2026-Q3) - Country/Market — Filter by geography (e.g.
USorCA) - Region — Available on the Regional Sales page (e.g.
West,East,Central,South)
Data Sources
The project uses the Superstore dataset. A flat, single-table CSV source containing transactional sales records for a fictional US-based retail company.
Semantic Model
As the source is a single flat table, no complex relational model was designed. Data is imported directly into Power BI with minimal transformation — the primary addition being a dedicated Date dimension for time-based analysis.
Fact Table
Sales— Core transactional table containing revenue, quantity, discount, and profit at the order-line level.
Dimension Tables
Date— Generated date dimension enabling quarter, month, and year slicing.
Key Measures
All DAX measures are defined in: DAX Measures
Design & Theme
The visual theme is defined in Superstore_Theme_Jandaghian_final.json and applied consistently across all report pages.
Other Projects
View all →
GA4 BigQuery Event Exploration & Dashboard
A GA4 ecommerce analytics project using BigQuery SQL, lightweight staging and mart tables, and Looker Studio to explore acquisition, engagement, and the purchase funnel.

My website: A portfolio built with agentic AI tools
Built this portfolio as a website with agentic AI tools, using Codex, Claude, ChatGPT, Git, and Vercel instead of a no-code website builder.
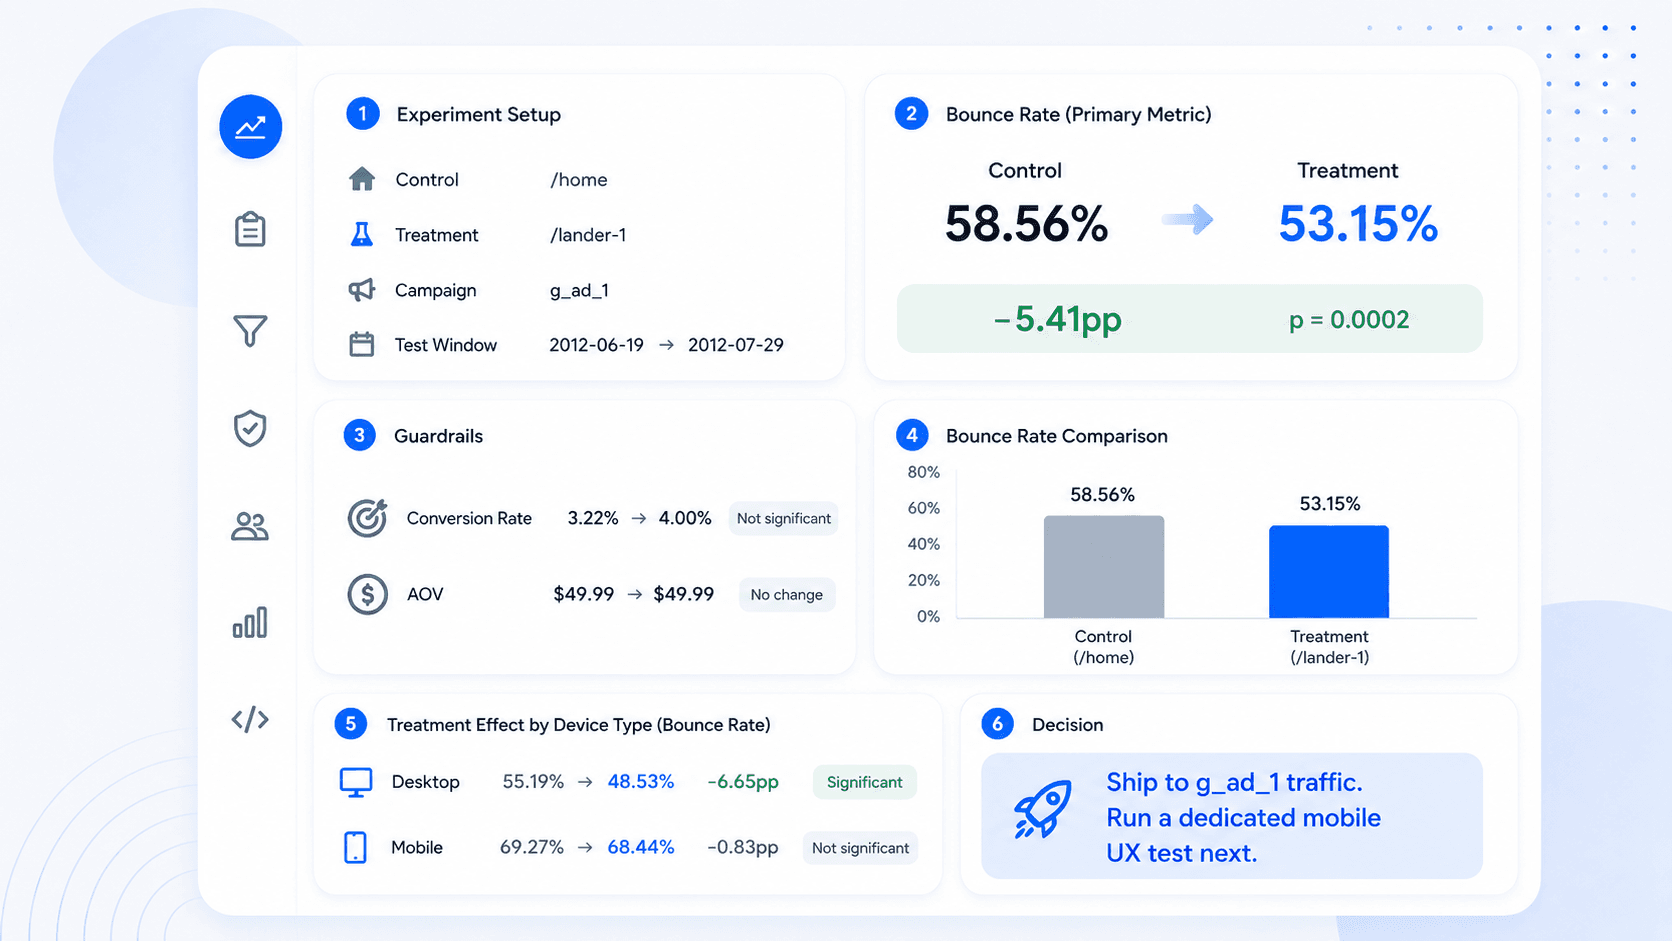
Maven Landing Page A/B Test Analysis
Analyzed a landing page experiment with traffic filtering, bounce-rate testing, guardrails, and treatment-effect cuts.
CONTACT
Want to compare notes on a project?
I'm always up for a sharp data or product conversation.
Get in touch