GA4 BigQuery Event Exploration & Dashboard
A GA4 ecommerce analytics project using BigQuery SQL, lightweight staging and mart tables, and Looker Studio to explore acquisition, engagement, and the purchase funnel.
Published July 2026
TL;DR:
I used the public Google Merchandise Store GA4 export to turn raw ecommerce events into reusable BigQuery tables and a three-page Looker Studio dashboard. The work covers 19 exploratory SQL queries, a lightweight staging-to-mart layer, and reporting for acquisition, engagement, and conversion.
Project Overview
GA4's interface is useful for quick answers. The BigQuery export is where the implementation details become visible: one event per row, nested parameters, repeated item arrays, and metric logic that has to be made explicit.
I built this project to practice that transition from raw event data to a reporting layer a Product, Growth, or Ecommerce stakeholder could use. The focus was not another dashboard for its own sake; it was making the data model, grains, and limitations clear enough that the dashboard would be interpretable.
Core question: How can raw GA4 events be modeled into a trustworthy view of acquisition, engagement, and ecommerce conversion?
Data & Modeling
The source is the public, obfuscated Google Merchandise Store export: bigquery-public-data.ga4_obfuscated_sample_ecommerce.events_*. Each row represents one event. To understand the schema before modeling it, I wrote 19 exploratory BigQuery queries covering event volume, dates, users, session keys, page parameters, geography, devices, acquisition fields, engagement, revenue, products, and funnel events.
The key transformation work was extracting values from event_params—including ga_session_id, page_location, session_engaged, and engagement_time_msec—and unnesting items without losing the intended grain. I then turned the exploration into a small, explicit reporting layer.
The source's traffic_source fields describe first-user acquisition, so I treated acquisition views accordingly rather than presenting them as session-level attribution.
Dashboard Structure
The dashboard has three pages, each focused on a different part of the ecommerce journey.
Business Overview
This page brings users, sessions, engagement rate, orders, revenue, conversion rate, acquisition, and country-level performance into one view.
Acquisition & Engagement
This page examines first-user acquisition alongside device, country, page-view, and engagement patterns.
Ecommerce Funnel
This page maps relevant ecommerce events from product discovery through purchase, with micro-conversion trends and source-level breakdowns.
What I Built
I turned one raw GA4 export into a small reporting system: event-level data in, reusable tables and a stakeholder-facing dashboard out.
- Exploration: 19 BigQuery queries to validate the event schema, session keys, engagement, ecommerce fields, and funnel events.
- Modeling: three staging tables and three dashboard marts, with event, user-session, and item-event grains kept distinct.
- Refresh logic: a rolling-refresh pattern that replaces recent staging data before reloading it.
- Reporting: a three-page Looker Studio dashboard, supported by documented data-model and metric logic.
Scope & Limitations
The public sample is historical, static, and obfuscated, so the dashboard is not a live business-monitoring implementation. It demonstrates the workflow from raw GA4 events to structured tables and stakeholder-facing reporting.
The source dimensions also constrain what can be concluded: acquisition fields are first-user attributes, not session-attribution fields; the funnel is event-mapped rather than strictly sequential; and a production deployment would need a measurement plan, agreed metric definitions, and data-quality checks.
Project Evolution
This is a multi-stage project. This page documents the completed GA4, BigQuery, and Looker Studio phase as a standalone piece of work.
Future phases will be added here only after they are completed, with their own scope, implementation, and outcomes.
Repository Guide
All material for this first phase lives in one directory, separated by purpose so the exploratory work, modeling logic, and dashboard assets can be reviewed independently.
Text
ph1-ga4-bigquery-event-exploration/├── docs/ # Source, event, dashboard, and pipeline notes├── sql/│ ├── exploration/ # 19 raw-data exploration queries│ ├── staging/ # Schema setup, table builds, and refresh simulation│ └── marts/data_studio/ # Dashboard-ready session, page, and funnel tables└── dashboard/looker/ # Dashboard link and screenshotsOther Projects
View all →
My website: A portfolio built with agentic AI tools
Built this portfolio as a website with agentic AI tools, using Codex, Claude, ChatGPT, Git, and Vercel instead of a no-code website builder.
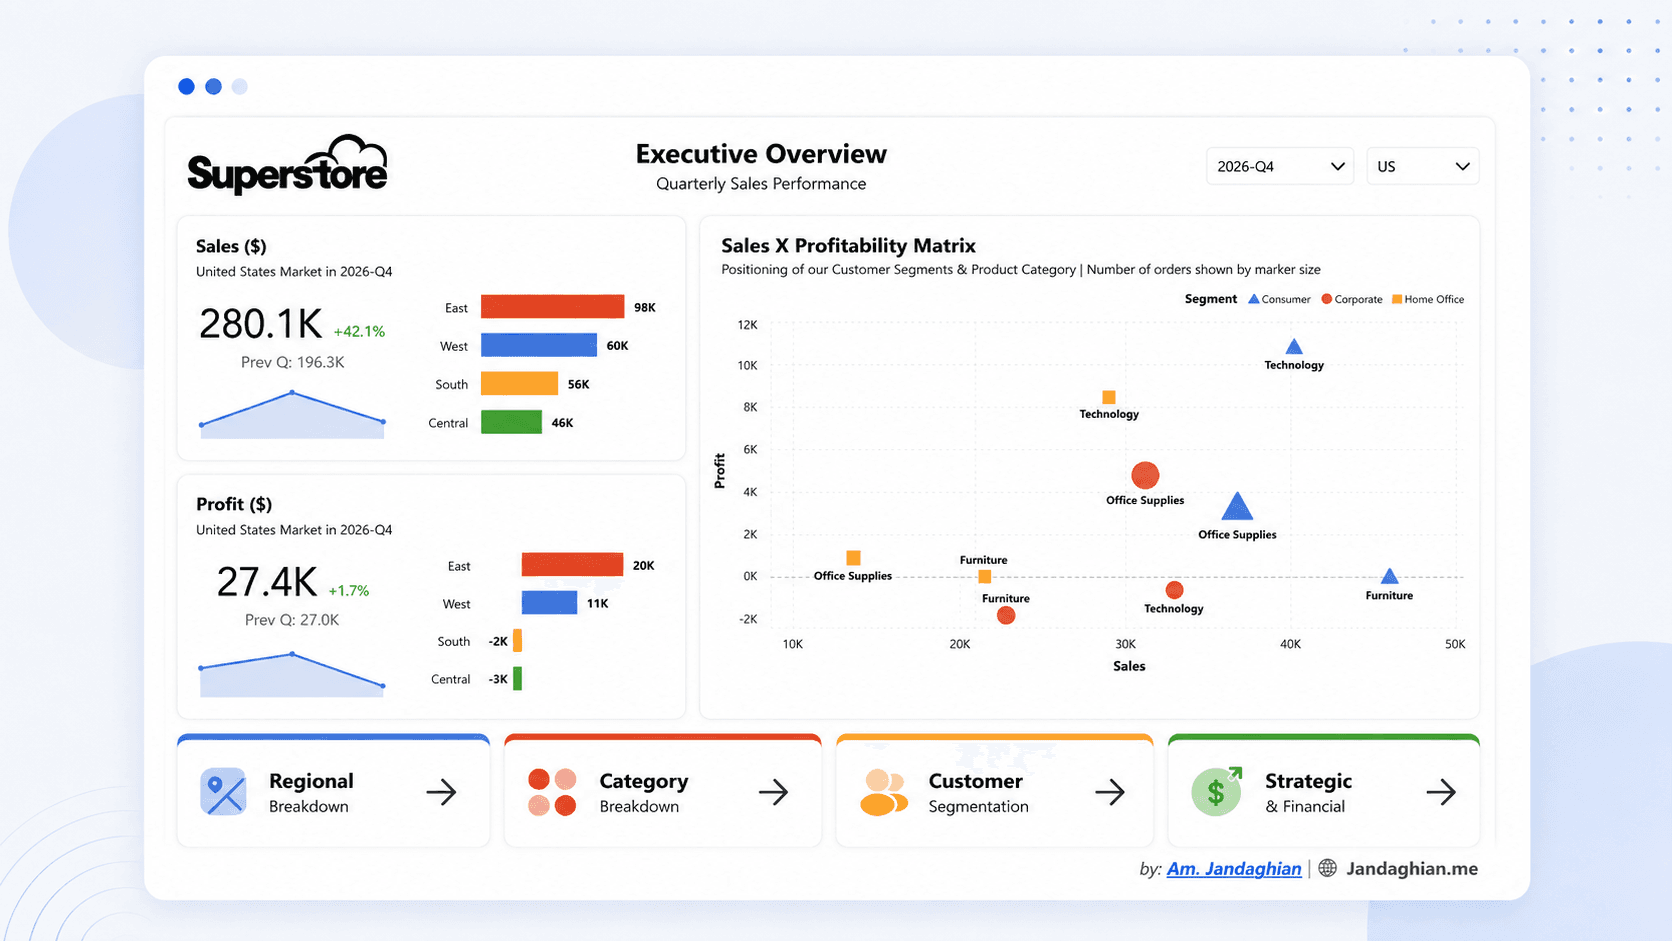
Superstore Sales Performance Dashboard
Built an executive Power BI dashboard on the Superstore dataset for quarterly sales, regional performance, categories, and customer segments.
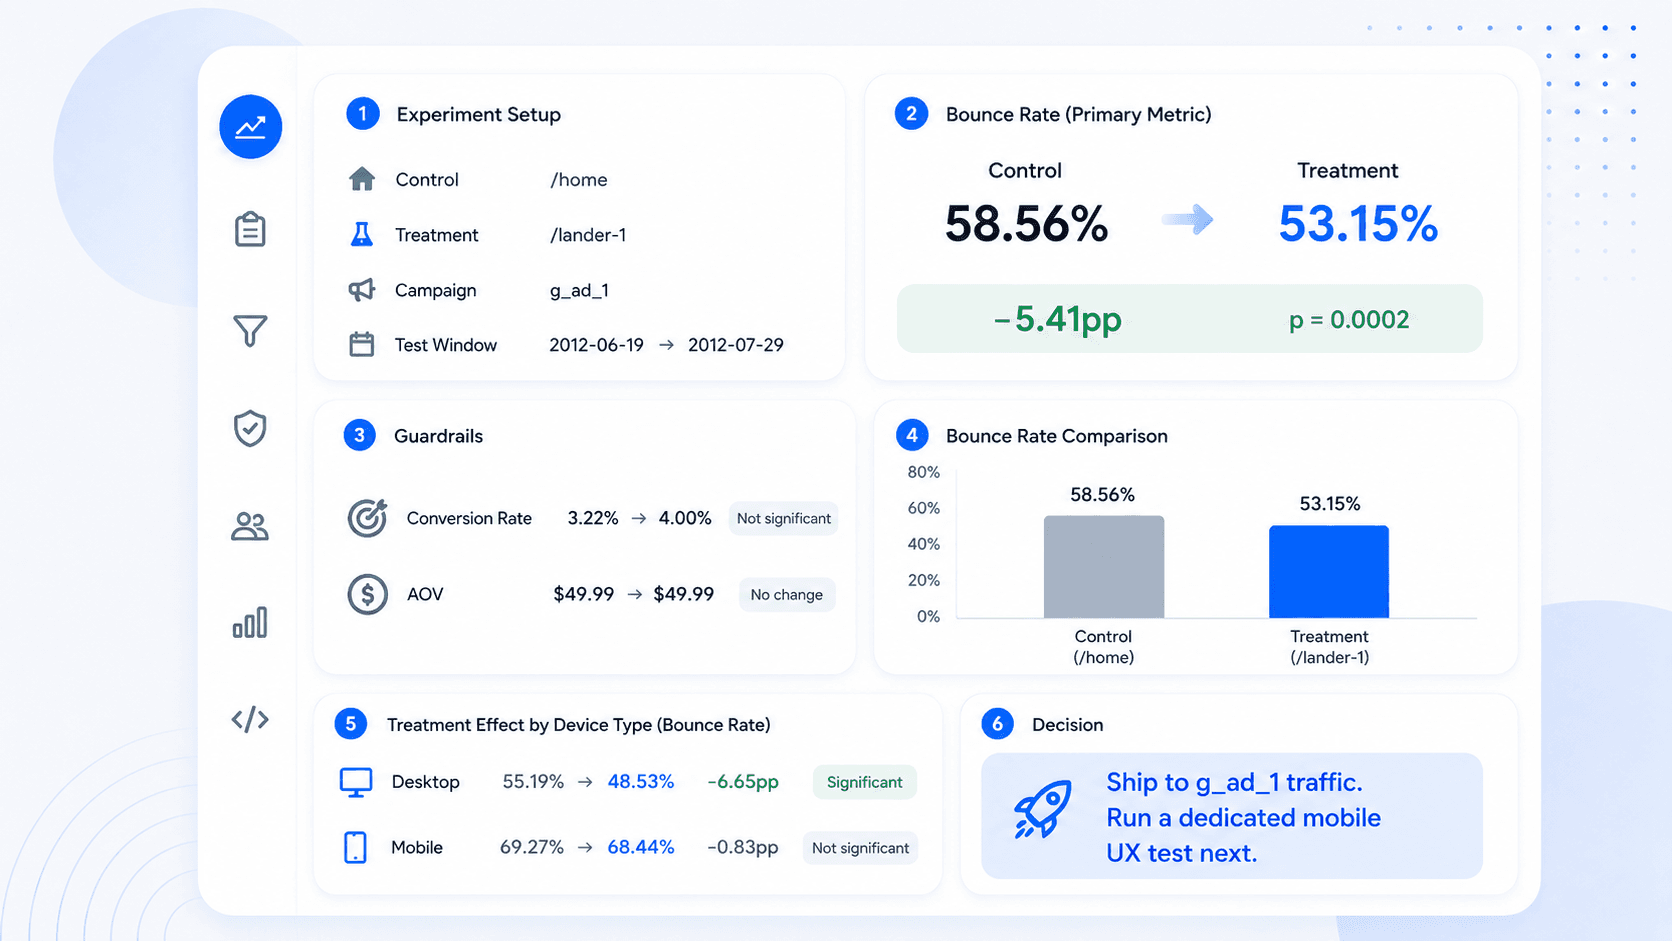
Maven Landing Page A/B Test Analysis
Analyzed a landing page experiment with traffic filtering, bounce-rate testing, guardrails, and treatment-effect cuts.
CONTACT
Want to compare notes on a project?
I'm always up for a sharp data or product conversation.
Get in touch