Marketing Performance Analytics for a Beverage Client
Designed a KPI framework and Power BI dashboard for a global beverage client, integrating retail, search, and social data into a single performance view for marketing leadership.
Published December 2024
This is an project developed within the Advanced Performance Management course at Politecnico di Milano, in collaboration with a global beverage industry client.
Problem & Context
In this collaborative project for a beverage client, our team was tasked with building a centralized performance measurement system. The goal was to transform disparate data streams, retail sales, digital search trends, and social media sentiment into a unified dashboard for internal stakeholders.
We designed a data-driven solution aimed at improving performance management through the definition and visualization of key performance indicators (KPIs). The project focused on developing a self-explanatory Power BI dashboard for decision-makers, offering an intuitive view of business performance aligned with specific business goals.
As part of our discussion with the client, we focused on the following assumptions and criteria:
- Scope: concentrate on the Marketing Department and a local brand portfolio in the Italian market.
- Decision-makers: prioritize senior marketing and digital stakeholders as the main users of the analysis.
- Commercial priorities: sales performance, promotion monitoring, and key business drivers.
- Digital priorities: audience visibility, online engagement, campaign reach, and sentiment.
Analytics Workflow
The project followed a structured workflow, starting with data collection and cleaning, followed by KPI definition and dashboard design. The process was iterative, with regular check-ins to align on business needs and technical feasibility.
Data Preparation & Cleaning
The inputs included retail sell-out data, search trend data, mention data, and brand reference files.
- Retail sell-out data: the commercial base layer.
- Search trend data: a demand and interest signal.
- Mention data: visibility and conversation signals across platforms and sources.
- Reference tables: brand and category mapping needed for consistent analysis.
We faced multiple challenges during the data preparation phase, which was critical to ensuring the reliability of our analysis and the insights derived from it. Some of the key challenges and our approach to addressing them included:
-
Inconsistent Brand Naming and Categorization The raw datasets contained multiple naming conventions for the same entities, leading to fragmentation when grouping data for a unified analysis. => We implemented a matching and standardization step and normalized text fields to improve consistency across the search and mention datasets.
-
Missing Promotion Labels in Sell-out Data Some promotion-related fields were unavailable, making it impossible to directly identify promotional periods. => We developed an alternative rule-based approach to flag candidate promotion periods.
-
Handling Null and Zero-Value Entries The search dataset contained rows with missing or zero values, which could skew performance trends. => We performed a missing data review and removed these entries to keep the final analysis consistent.
-
Data Redundancy and Duplicates Consolidating multi-year data across different sources often resulted in duplicate entries and redundant columns. => We performed systematic deduplication and dropped irrelevant fields to streamline processing.
-
Temporal Alignment and Granularity Data sources had different time formats and levels of granularity. => We aligned the time fields into a common structure and used aggregation with drill-down options for consistent analysis.
-
Cross-Source Integration Linking disparate datasets required a common identifier for correlation analysis. => We used shared reference keys across the datasets to support seamless merging and cross-source analysis.
KPI Definition
The KPI framework was designed to align with the specific business questions of the marketing leadership. We focused on defining metrics that were actionable, measurable, and directly tied to the decision-making needs of our stakeholders. To bridge the gap between raw data and strategic decision-making, we carefully selected a suite of KPIs that align digital metrics with commercial outcomes. These metrics were chosen based on strategic alignment with key business goals, data availability, and their relevance to the main marketing stakeholders.
Below is a summary of how our business aims translate into specific assessments, dashboard views, and the metrics used to track them:
| Decision Maker | Business Aim | Assessment | Dashboard | KPIs |
|---|---|---|---|---|
| Marketing Head | Revenue Growth and Profitability | Understand Key Drivers of Sales Performance | Sales Drivers Insights | Correlation of Sales Volume with Mention and Search |
| Track Sales Trends and Evaluate Promotions | Sales and Promotions Overview |
| ||
| Strengthen Market Position | Monitor Brand Sentiment and Market Position | Brand Health Overview |
| |
| Digital Marketing Manager | Market Expansion and Digital Presence | Assess Search Trends and Online Engagement | Digital Visibility Search |
|
| Optimize Campaigns for Audience Reach and Sentiment | Digital Visibility Mentions |
|
Dashboard Design & Visualization
The interactive dashboard translates our prepared data into actionable views. It is structured into five distinct pages, designed to align with the strategic needs of the main stakeholders.
1. Sales Drivers Insights
|
2. Sales & Promotion Overview
|
3. Brands Health Overview
|
4. Digital Visibility - Search
|
5. Digital Visibility - Mention
|
My Contribution
I worked on this project as part of the Advanced Performance Management course at Politecnico di Milano in a team setting, where I:
- Co-led the data cleaning phase with another teammate.
- Actively participated in KPI design and dashboard construction.
- Ensured the final outputs were analytically robust and aligned with project objectives.
Final Deliverables
Because the project was completed under confidentiality constraints, this write-up emphasizes methodology and system design rather than private business outcomes.
- Jupyter notebooks for data cleaning, mapping, enrichment, and KPI creation.
- Cleaned CSV datasets ready for downstream analysis.
- A Power BI dashboard for exploration and executive discussion.
- Technical documentation (methodology, data lineage, KPI definitions) for engineering review.
- Executive presentation and report layer for managerial stakeholder communication.
Other Projects
View all →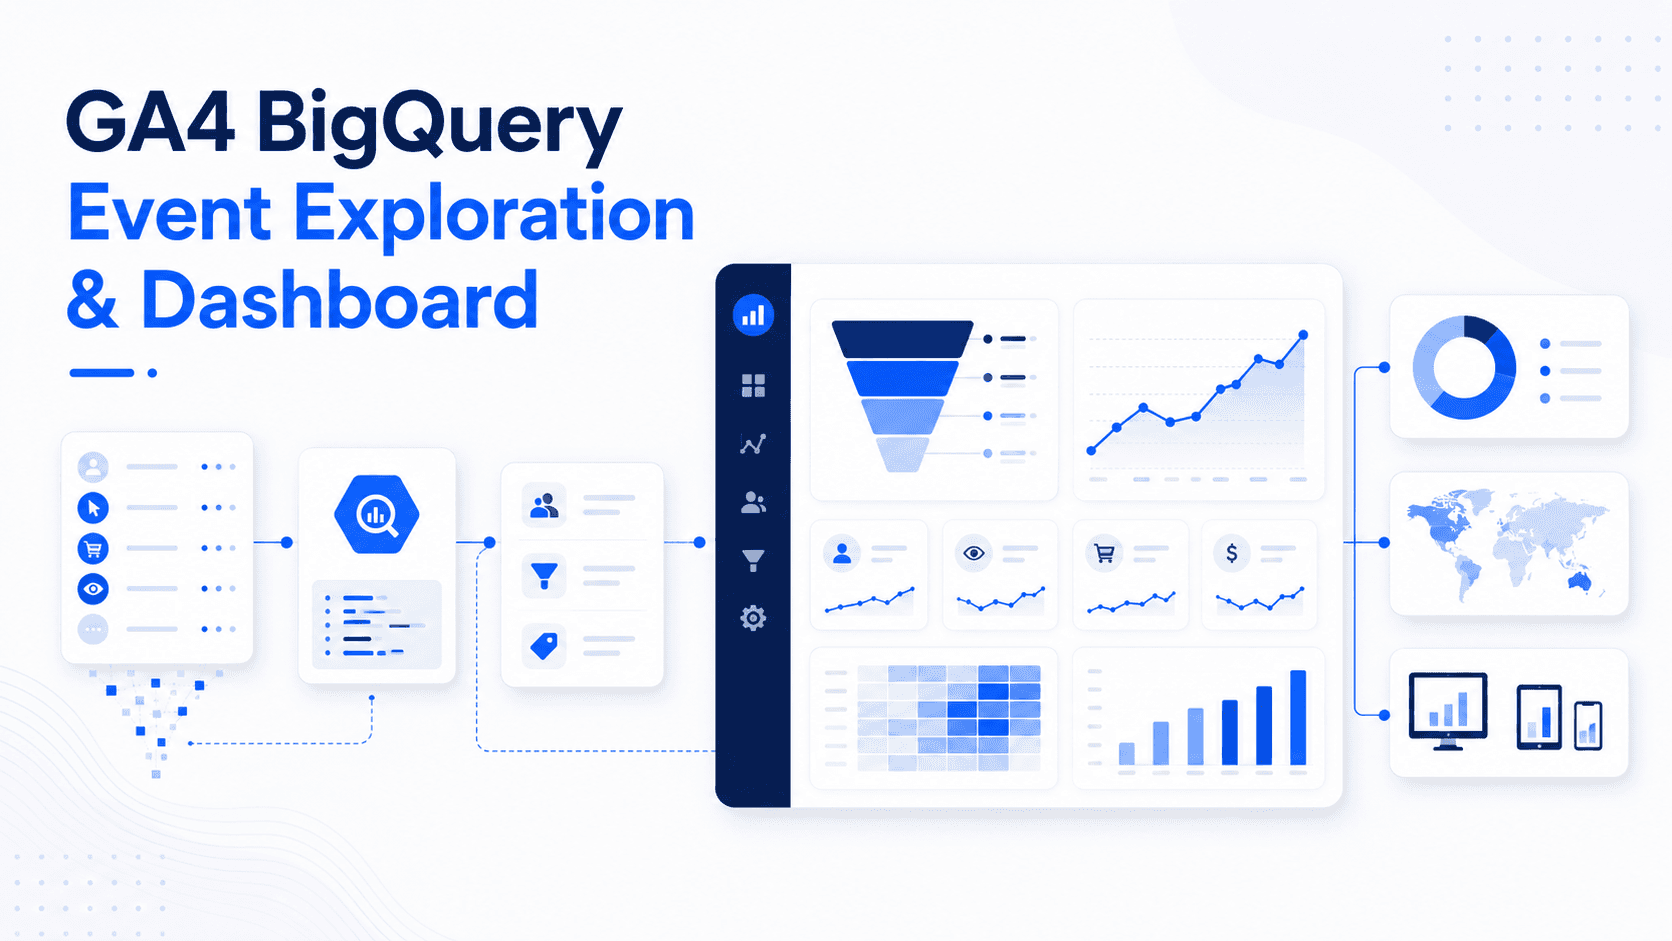
GA4 BigQuery Event Exploration & Dashboard
A GA4 ecommerce analytics project using BigQuery SQL, lightweight staging and mart tables, and Looker Studio to explore acquisition, engagement, and the purchase funnel.
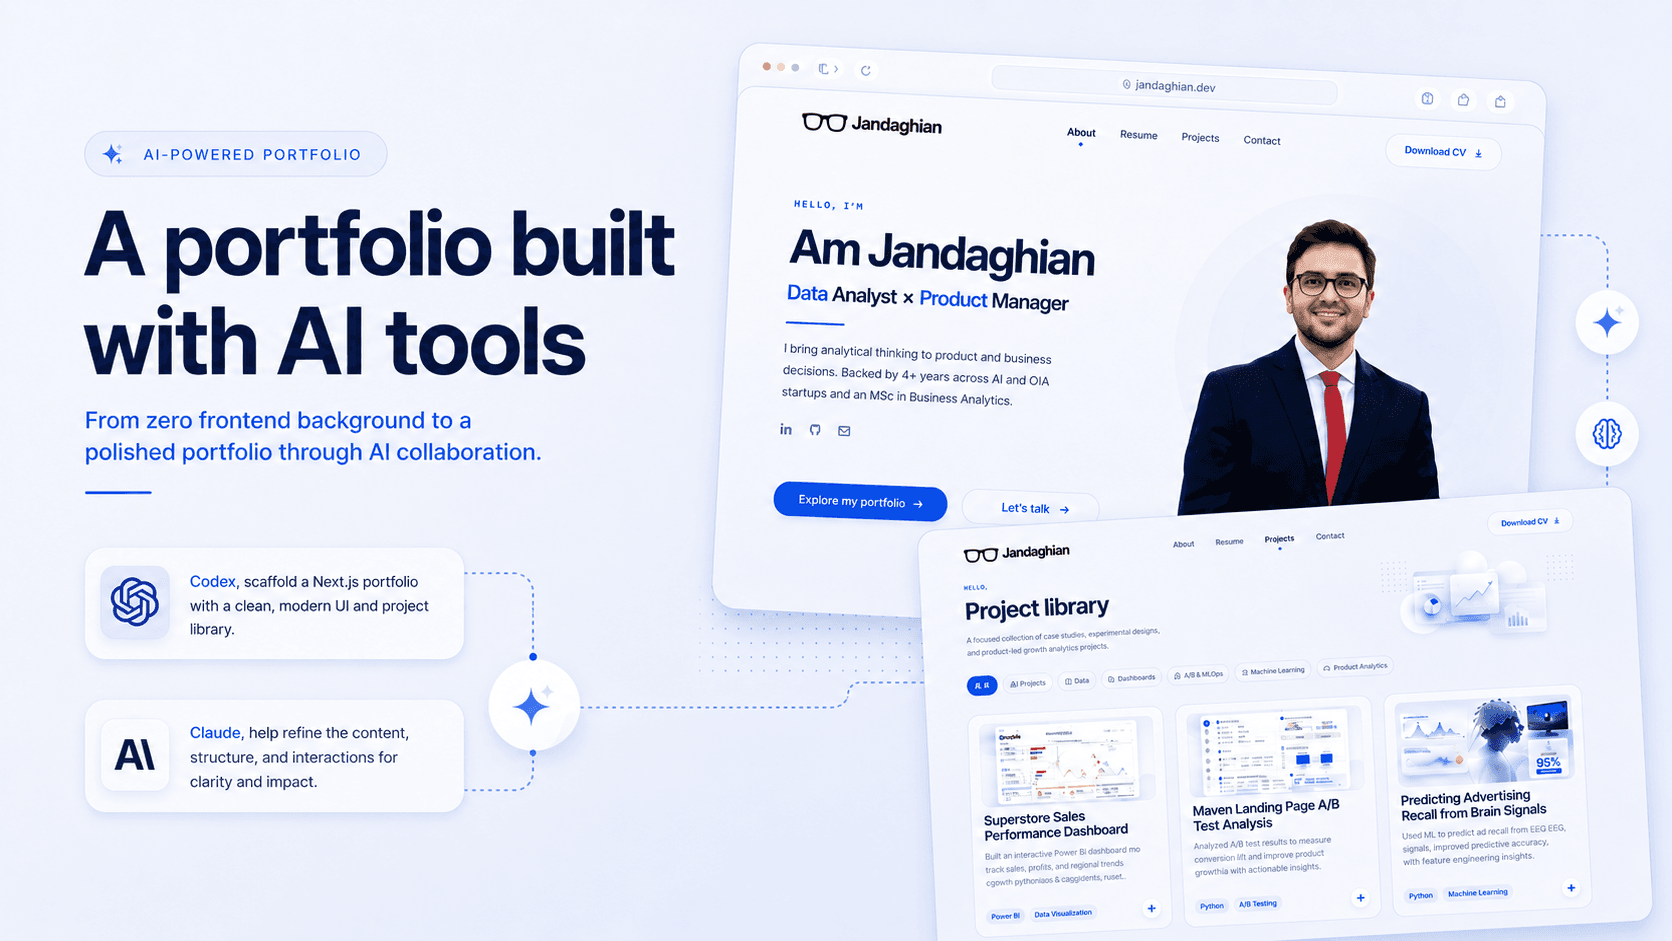
My website: A portfolio built with agentic AI tools
Built this portfolio as a website with agentic AI tools, using Codex, Claude, ChatGPT, Git, and Vercel instead of a no-code website builder.
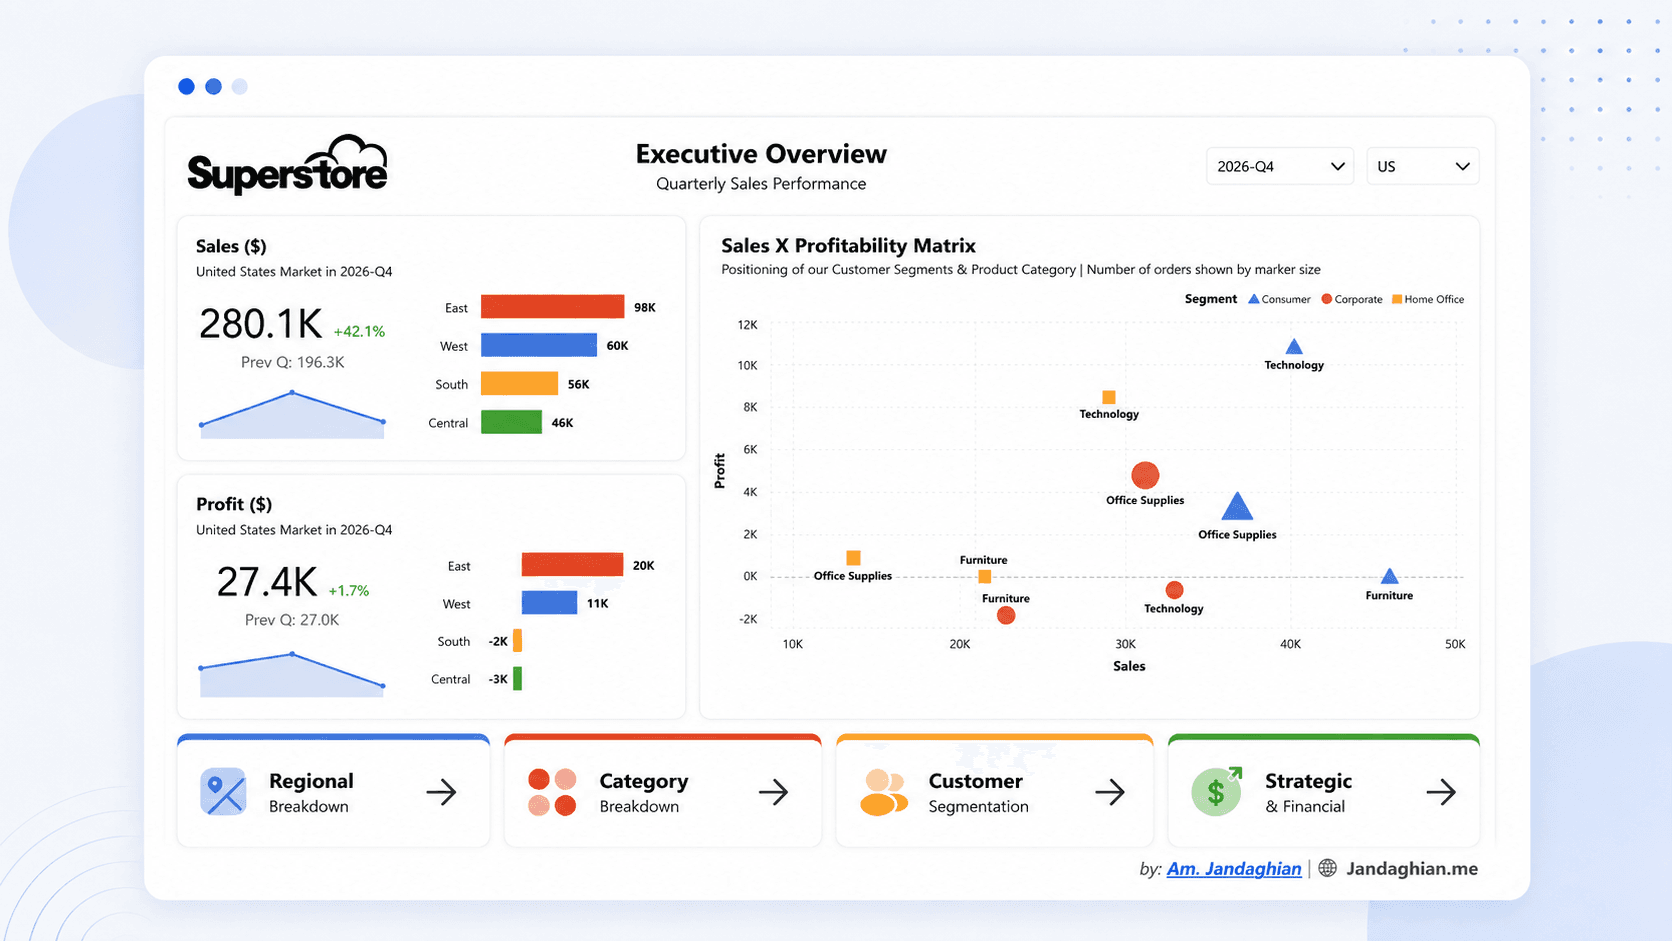
Superstore Sales Performance Dashboard
Built an executive Power BI dashboard on the Superstore dataset for quarterly sales, regional performance, categories, and customer segments.
CONTACT
Want to compare notes on a project?
I'm always up for a sharp data or product conversation.
Get in touch